Perch: a private control center for my Mac mini
A bird in the menu bar, a real heartbeat from my Mini, and one screen for the things I want to check. A running build log for my open-source, self-hosted Mac dashboard.
Updated
On this page 6 sections
I wanted a quick way to check on my Mac mini from my laptop or phone. When did it last report? How much memory is it using? Are my tmux sessions still there? I wanted to open one screen, get an answer, and get back to whatever I was doing.
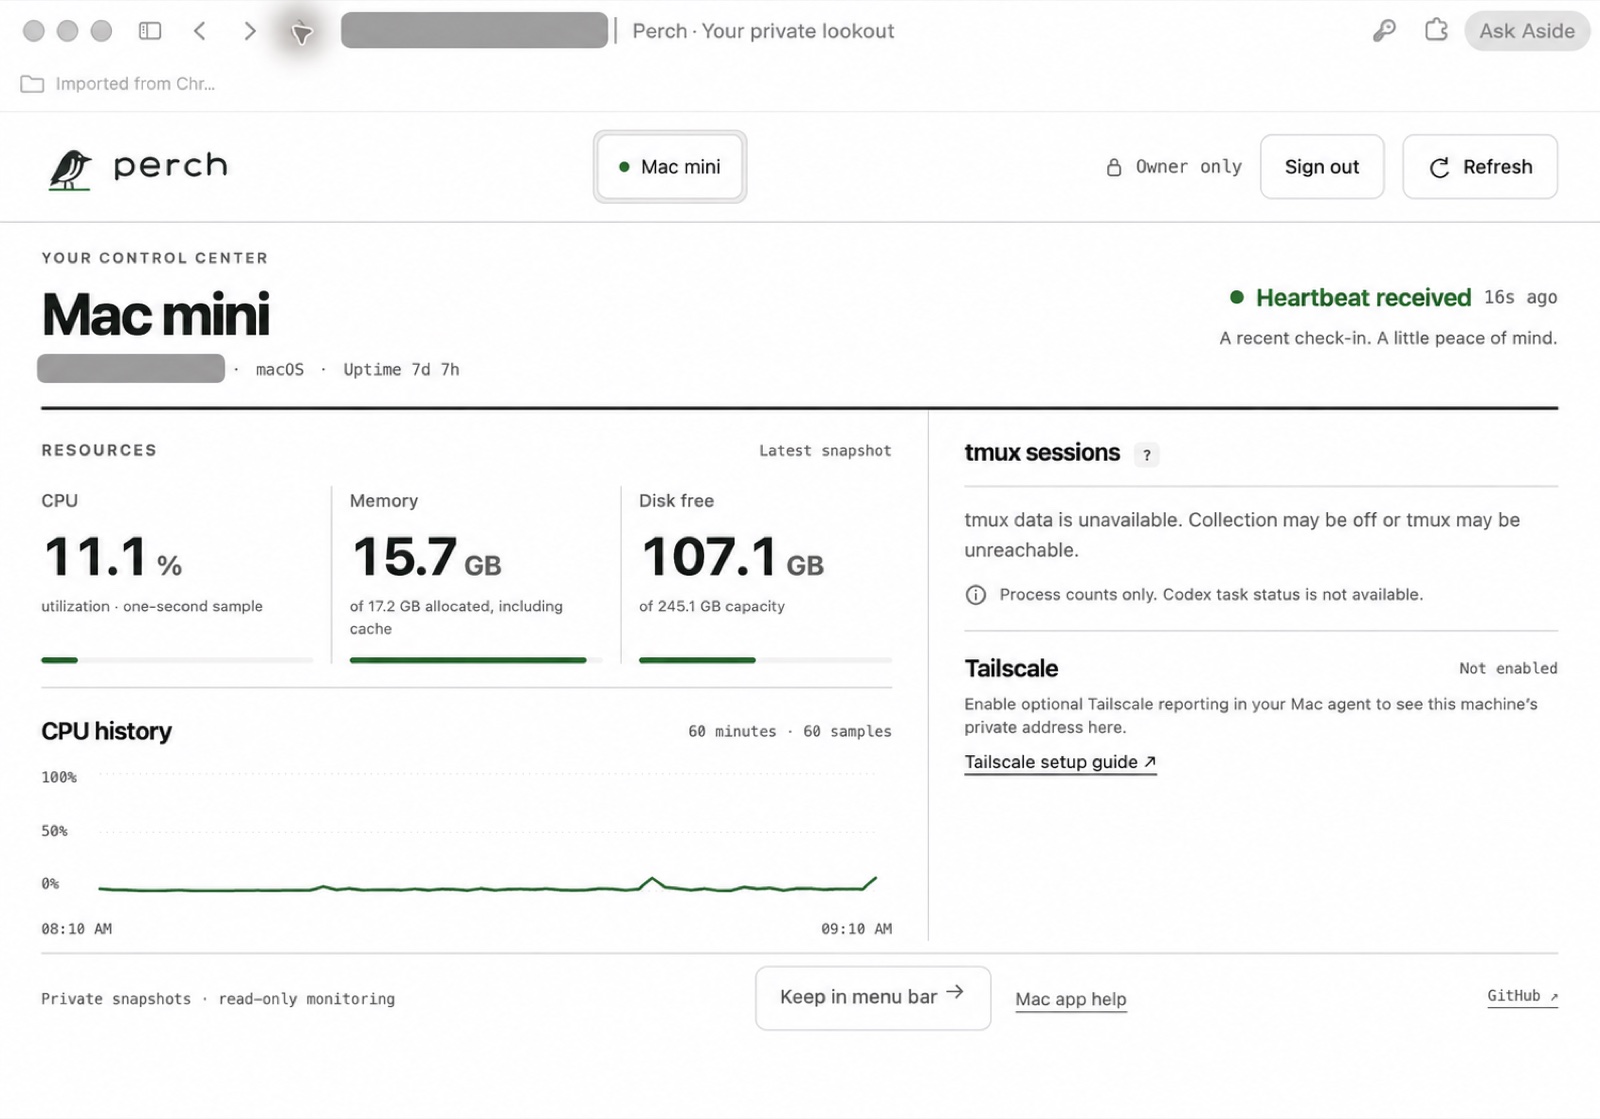
Perch now does that. The screenshot above shows the working dashboard with a real snapshot from my Mini, captured on October 11, with the server address and machine hostname hidden. The values belong to that moment; this is no longer a mockup with sample data.
Perch is open source under MIT and self-hosted. Each person uses their own Google account, database, and machine credentials. There is no shared Perch account service. My installation only accepts my configured Google owner, and the Mac sends its heartbeats to my server.
This post is the running build log. I'll keep the explanation current and add dated milestones as the project improves.
Everything I wanted to check, together
The first dashboard had a large centered machine name, a little Mac illustration, and plenty of white space. I liked the look, but most of a laptop screen went toward introducing the machine. Resources were further down, sessions lived behind a tab, and Tailscale required more scrolling.
I wanted a control center. The current layout keeps the machine name and heartbeat at the top, resources and CPU history on the left, and sessions and Tailscale on the right. The main sections fit together at the laptop sizes we tested, including 1280 × 720. Long session lists paginate. On a phone, the sections stack and scroll so the text stays readable.
The bird, white canvas, bold type, and restrained green signals stayed. The change was mostly about giving the useful information more of the screen.
There are deliberate gaps in my screenshot. tmux collection is unavailable and Tailscale reporting isn't enabled on this installation. Perch says so. An unavailable measurement should never turn into a reassuring zero just because zero is easier to render.
The bird on my laptop has a different job
One of the most confusing parts showed up after monitoring was already working. I opened the native app on my laptop and it asked for a server URL, machine ID, and machine token. My Mini was sending heartbeats, but the laptop still looked like it needed setup.
The app assumed that every Mac running Perch should become a collector. I only wanted the laptop to open my dashboard.
Now the signed-in website has a Keep in menu bar action. With the app installed, that opens Perch and asks me to confirm the dashboard address. The bird then offers View my machines, which opens the portal in my browser. Google sign-in stays there. The handoff carries the dashboard address, with no cookie, machine token, or snapshot.
Monitor this Mac is a separate option. Saving a dashboard on the laptop doesn't start collecting from it or change an existing monitoring connection. I checked the website-to-app-to-browser round trip and confirmed that quitting and reopening the app remembers the dashboard.
The native Mac app is a developer preview, built with SwiftUI and AppKit. Its universal DMG contains an app, and it doesn't require Node.js. Developer ID signing and notarization are still pending, so macOS may block the preview from opening. The separate Terminal agent ZIP remains available for the Node.js path.
The page has to outlive the heartbeat
The web application runs on Vercel, with snapshots and bounded history in Upstash Redis. The reporting agent sends outbound HTTPS requests from the monitored Mac. It doesn't need an inbound port.
That separation matters when the Mini stops reporting. As long as the hosting and storage services are available, I can still open the page and inspect its last snapshot.
I tested this by stopping the reporting service for more than three minutes. The dashboard kept the previous resource values, changed to Heartbeat overdue, and said the machine's current state was unknown. Starting the service again produced a fresh heartbeat and restored the normal view.
A missed heartbeat cannot tell me whether the Mac is asleep, powered off, disconnected, or running with a broken agent. Perch distinguishes a recent report, an aging snapshot, an unavailable metric, and sample data. It doesn't turn an absence of evidence into a power-state claim.
The verified reporting path on my Mini is currently the Node.js 22 agent running as a user LaunchAgent. Native app heartbeat integration with the hosted server still needs verification, as do automatic relaunch behaviors. The working menu-bar shortcut and the working background collector are separate milestones.
What private means here
Every status read requires server-side owner authorization. Google ID tokens are verified against the configured owner, and the browser receives a signed HttpOnly session cookie. Each machine gets a separate write-only heartbeat token, scoped to that machine. Possessing one of those tokens does not grant access to the dashboard API.
Snapshots, sessions, and login nonces are scoped to the installation and owner. Each person should still use their own database and secrets. Hosting and database credentials remain privileged; this is self-hosting, not a way to hide data from the infrastructure storing it.
The current checks cover anonymous reads, forged sessions, machine-token reads, writes to another machine, session expiry, and delayed responses after sign-out. Owner Google sign-in and Redis-backed monitoring have worked together on the real installation. Rejection of a second real Google account still needs an end-to-end check. The security document tracks these boundaries and limits.
Perch collects resource measurements and optional tmux metadata. It doesn't capture terminal output or offer remote execution. A foreground codex process is only evidence that the process exists; it doesn't establish whether a task is working, finished, or waiting. Structured activity from my separate Codex harness is future work.
Optional Tailscale reporting includes only the local machine's state and addresses. It doesn't enumerate the rest of the tailnet, require an admin token, or make the Vercel URL tailnet-only. Owner authentication still applies.
Try it locally
The easiest way to explore the interface is the local demo. With Node.js 22 installed:
git clone https://github.com/mager/perch.git
cd perch
npm ci
npm run demo
Open localhost:8787/app. The demo needs no Google or Redis credentials, uses fictional machines, and cannot accept real heartbeats. Its state selector lets you inspect stale data, first-heartbeat onboarding, unavailable metrics, and connection errors. Press Control-C in the terminal to stop it.
For a real installation, the repository's setup guide covers the hosted portal and collector. Server provisioning and machine credentials still take configuration. I want that path to become much simpler; the menu-bar shortcut fixes the viewing experience, but it doesn't eliminate server setup or securely pair a new collector yet.
Build log
October 4, 2026: backend, bird, and first dashboard
Built heartbeat ingestion, owner authentication, Redis snapshots, the Node.js collector, and a local sample dashboard. The visual direction moved from a dark terminal style to a white canvas, with a perched bird and bird-on-Mini artwork. Node.js stayed for the web backend; a rewrite had no demonstrated performance benefit.
The first audits fixed unavailable metrics being reported as zero, added installation scope to stored records and sessions, and prevented a delayed response from restoring private data after sign-out. Optional Tailscale metadata and a reproducible Terminal-agent source ZIP followed.
October 10, 2026: an actual Mac app and a real heartbeat
Downloading a source folder made it obvious that the Mac download should contain an application. Built the native menu-bar preview with Keychain token storage and published a universal DMG through GitHub Releases. Improved its connection form and fixed the menu panel and setup window opening over each other.
Configured the hosted portal and installed the Node.js background agent on the Mini. Verified owner sign-in, a real Redis-backed heartbeat, an interruption lasting more than three minutes, and recovery with the previous snapshot retained throughout.
October 11, 2026: separate viewing from monitoring
Added the website-to-app dashboard handoff and the View my machines menu action. Verified the real round trip and persistence after quitting and reopening the app. Published the 0.3.0 developer-preview DMG. Monitoring the laptop is now a separate, optional choice.
October 11, 2026: the control center
Replaced the oversized dashboard introduction and tabs with the compact layout shown above, then deployed it and checked the live page with the Mini reporting. The current suites pass 36 Node/backend tests, 21 browser checks, and 12 Swift tests. Browser checks include laptop and phone layouts, long-session pagination, stale snapshots, authentication boundaries, injection handling, and automated accessibility checks.
Next are simpler collector pairing, verified native heartbeat integration, and a signed, notarized Mac release. Those are still work ahead.